Dashboards
Read the shop and project dashboards in Insights to see how production is performing.
Last updated 6 days ago
Introduction
A dashboard is a saved set of charts and figures built on your live production data. Dashboards live under Insights, and they are where you go to see how the shop is performing rather than what any single order is doing.
This guide covers the parts every dashboard shares: finding one, setting the period it covers, narrowing it, reading a widget, and opening the detail behind a number.
Step-by-Step Guide
Getting There
Open Insights in the left navigation. Every dashboard set up for your organization is listed under it by name. Click one to open it.
Dashboards open on their first page, with the page names running across the top.

Customized to You
Pages, charts and figures are configured per organization. One company's dashboard opens on pages named Outlook, Departments, People and Projects. Another opens on Completions, Stalled Orders and Hours. A third is organized around stages and panels.
So treat any page or chart named in this guide as an example, not as something you should expect to find. What is consistent is the controls around the charts, which is what the rest of this guide describes. If you need a page that does not exist on yours, that is a change to your dashboard rather than a setting you can switch on.
Choosing the Period
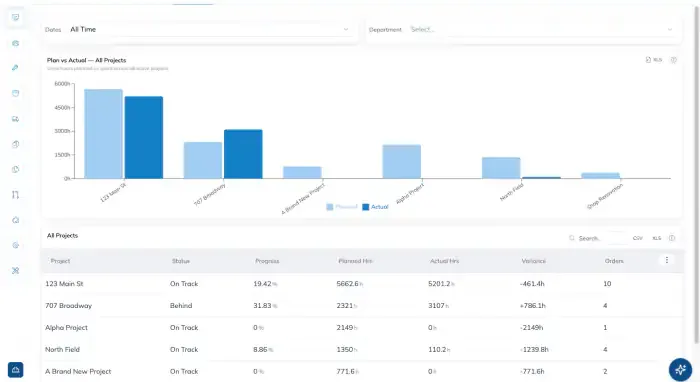
The Dates control sets the window every widget on the page is measured over. It offers Today, This Week, Last Week, Last 30 Days, This Month, Last Month, Last 3 Months, All Time, and Custom Range for your own start and end.
A widget reading "No data" usually means the period, not a fault
Charts only count work that falls inside the selected window. On a narrow period, a dashboard can show almost nothing while the underlying data is fine. Widen the range before assuming something is broken.
Narrowing by Project or Department
Beside the dates sit Project and Department selectors. Picking one filters every widget on the page at once, so the figures stay consistent with each other. Leave them empty to see the whole organization.
Not every page carries both. A page built around departments may offer only the department selector.
Reading a Widget
Each widget has a title and a line underneath saying what it measures. Read that line before trusting a number: two charts on the same page can both say "hours" and mean different things.
The information icon in a widget's top corner explains how that figure is calculated.
XLS, and CSV on tables, export exactly what the widget is showing, with your filters applied.
Charts that trend over time usually offer Weekly and Monthly grouping.
The man-hour and percent figures on these dashboards are the same ones that appear on every order and stage. See Progress & Man Hours for what they mean.
Opening the Detail Behind a Number
Tables and charts are usually clickable. Clicking a project, a person or a stage opens a page focused on just that one, carrying your date range with it.
These detail pages are part of the dashboard, so use your browser's back control to return to where you were.
Refreshing
The top right shows the time the page loaded, with a Refresh beside it. Dashboards do not update while you watch them, so use Refresh after someone has logged hours or closed out work.
Sharing a Dashboard
A public link opens a dashboard read-only for anyone who has the address, with no login and no account. Use it to put a dashboard on a screen on the shop floor, or to show someone outside the company a set of numbers without adding them as a user.
Open the dashboard and set its filters to what the link should show. Then click Public link in the toolbar.
Click New link.
Give the link a Name. The name is how you keep track of the links you are sharing, so pick one that tells you where this link went, for example "Shop floor, bay 2".
Under Who drives the filters, pick one:
Fixed view: readers see the filters you set and cannot change them. Use this for a screen on a wall, or to share one department's numbers with that department.
Reader can change the filters: your filters are where the page opens, and the reader can pick others from there.
Under What is on the page, click Choose on the dashboard to leave out pages or widgets. Untick anything the link should not show, then click Done. The link shows everything unless you narrow it.
Set the Time zone that date ranges like Today should follow.
Add an Expires date if the link should stop on its own. Leave it empty and the link runs until you turn it off.
Click Preview to see exactly what a reader will see.
Tick the confirmation that anyone with the link can read what you selected, then click Create link.
Click Copy link and paste the address wherever it needs to go.

Letting readers change the filters opens up every department
With Reader can change the filters, a reader can choose any department, including ones your filters did not name. If a link is for one department only, use Fixed view.
Not seeing Public link? Reach out to your company admin to update your permissions. Creating links takes the Public Dashboard Links permission, which admins have by default. See the Roles guide.
Managing Public Links
Click Public link on a dashboard to see its links, with each one's status, what it shows, and when it was last opened. Settings > Public Links lists every link across your organization, with who turned it on and when.
From a link's row you can:
Edit its name, content or expiry. To change its filters, set them on the dashboard, then edit the link and tick Replace with the dashboard's current filters. The address stays the same.
See which devices loaded the link, how many times, and when, under Who opened it.
Turn off the link to stop it immediately for everyone, including any screen showing it. Turn back on brings back the same address, so anyone who ever had it can read the page again.
Replace link to issue a new address with the same name and content. The old one stops working. Use this when a link has gone somewhere it should not, then paste the new address into every screen that used the old one.
Paused links
If someone edits the dashboard in a way that would show more than the link was set up for, the link pauses until you check it. Open Public link, look at what changed, and click Resume.

Tips
Set the period first. Every figure on the page depends on it, and it is the usual reason two people quote different numbers from the same dashboard.
Export rather than retype. XLS and CSV carry the filters you set, so the file matches what you were looking at.
Check the subtitle before comparing two widgets. Planned, actual and expected hours are different measures and often sit side by side.
Name each public link after where it runs. "Shop floor, bay 2" tells you which screen stops showing the dashboard when you turn a link off or replace it.
FAQ
Why does my dashboard look different from a colleague's?
Dashboards are configured per organization, and some are built for a particular team. If you are in different organizations, or looking at different dashboards, the pages will not match.
Can I change which charts appear?
Not from the dashboard itself. The layout is part of how the dashboard was built, so changes to it go through whoever set it up for you.
A number looks wrong. Where do I start?
Check the date range and the project and department filters first, then open the information icon to see how the figure is calculated. Most surprises come from one of those three.
Does someone need a Building Swell login to open a public link?
No. Anyone with the address can read it without signing in. Readers cannot edit anything or export the figures.
I edited a dashboard and its public link now says "This page isn't available". Why?
The edit would have shown more than the link was set up for, so the link paused. Until someone confirms it, anyone opening the link sees This page isn't available instead of the dashboard. Open Public link on the dashboard, check what it now shows, and click Resume.
Conclusion
Dashboards answer questions about the shop as a whole rather than about one order. Set the period, narrow to what you are asking about, and open the detail behind anything that looks off.
Still need help? Ask the team